AppLovin Axon Performance: KPIs & Optimization Guide
Measuring Performance with AppLovin Axon: KPIs That Actually Matter
If you’re running campaigns through AppLovin’s Axon, you already know it’s one of the most powerful AI-driven platforms in mobile marketing. But let’s be honest—power doesn’t mean plug-and-play. To get real results, you need to know what success looks like, which KPIs actually matter, and how Axon thinks when it’s optimizing your campaigns.
This guide breaks down the metrics that move the needle, the mistakes that quietly drain your budget, and the strategies that help you scale with intention.
Before we dive into the numbers, let’s look at how Axon actually works behind the scenes. Understanding its optimization logic will help you make smarter decisions and avoid common missteps.
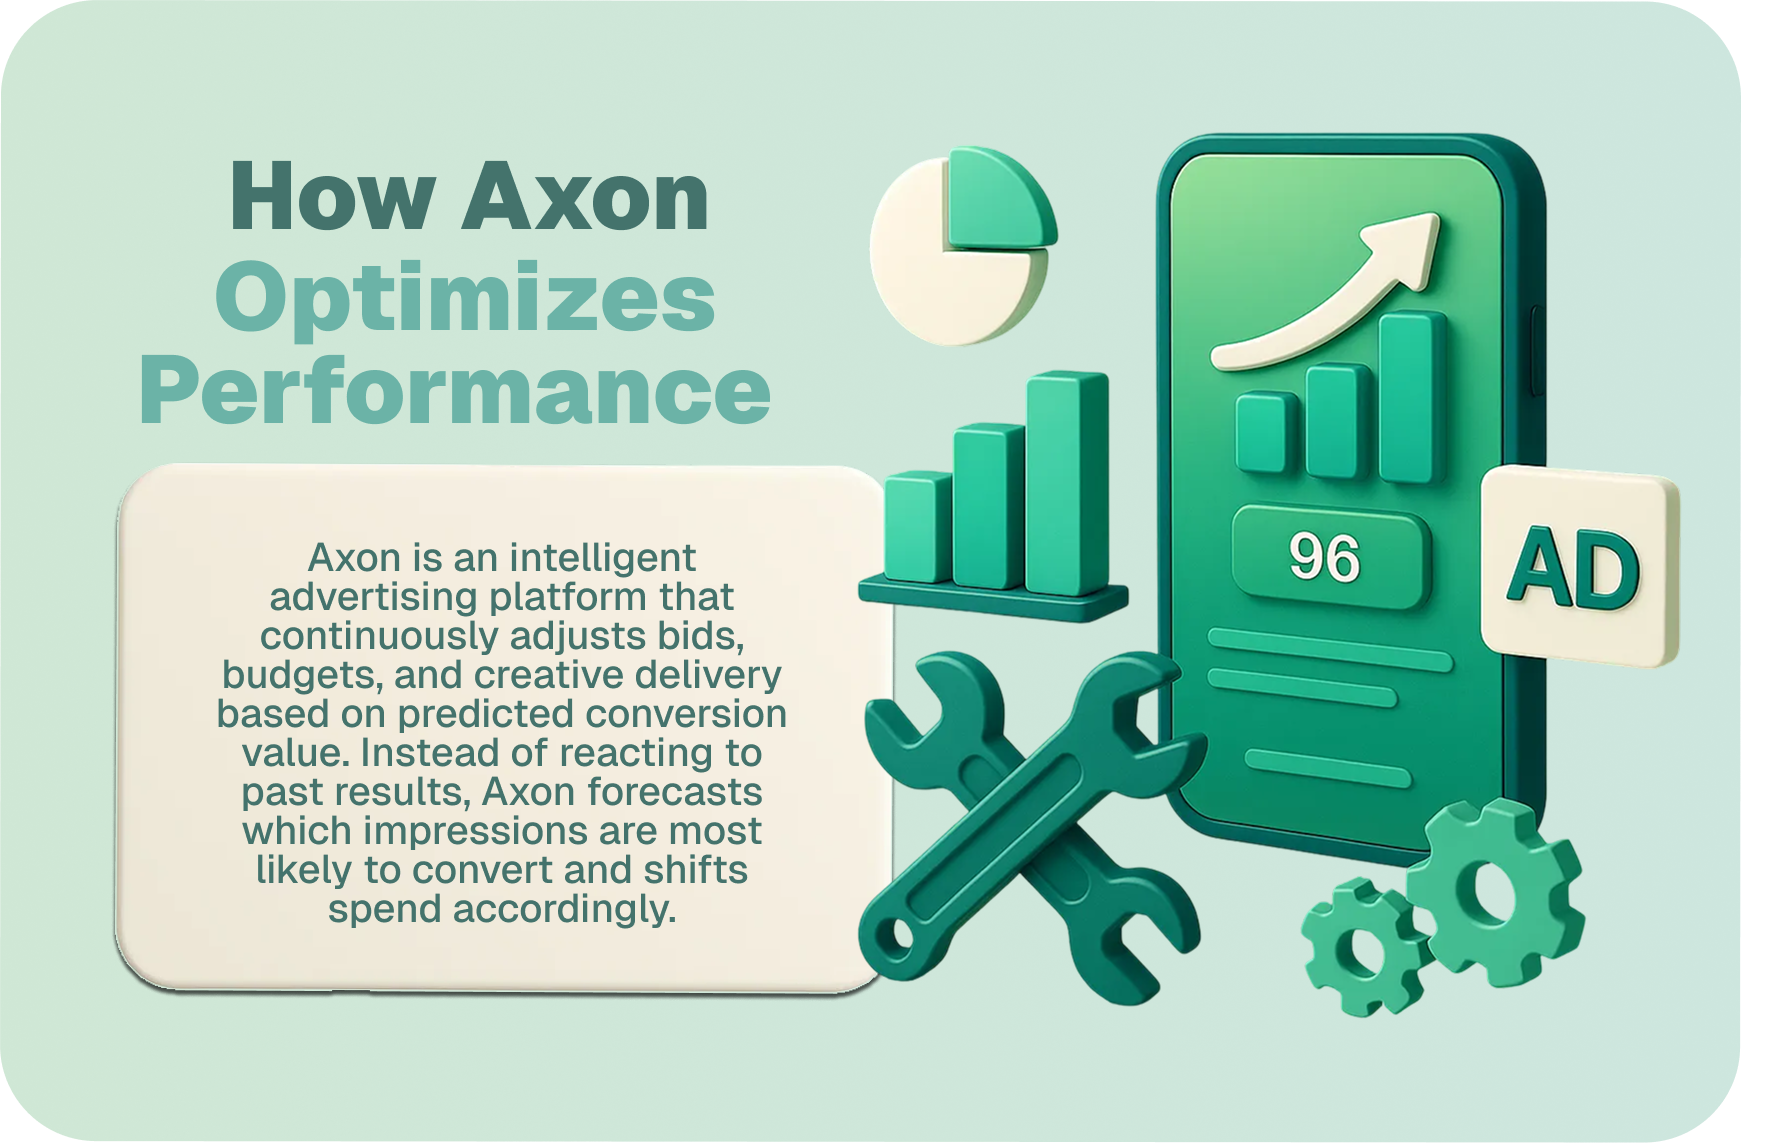
1. How Axon Optimizes Performance
Axon is an intelligent advertising platform that continuously adjusts bids, budgets, and creative delivery based on predicted conversion value. Instead of reacting to past results, Axon forecasts which impressions are most likely to convert and shifts spend accordingly. This allows advertisers to scale efficiently without manual targeting or bid adjustments.
Predictive Bidding and Optimization
Axon’s models analyze thousands of data points across ad performance to automatically adjust bids in real time. It focuses budget on impressions most likely to deliver return, whether your goal is:
- ROAS (Return on Ad Spend): Ideal for revenue-driven campaigns
- CPP (Cost Per Purchase): Useful for acquisition efficiency
Axon does not rely on user-level tracking or manual segmentation. It uses aggregated, privacy-safe signals — such as pixel-based conversion data, device context, and engagement trends — to model conversion likelihood and optimize delivery.
Creative Learning and Cross-Campaign Intelligence
Axon evaluates how audiences respond to your creatives — which formats, visuals, or messages drive stronger engagement and conversions — and continuously prioritizes top-performing assets.
Over time, it learns from aggregate campaign data to improve performance across both web and mobile environments:
- Underperforming creatives are suppressed automatically
- High-performing variants are prioritized
- Creative fatigue is detected through engagement patterns
Advertisers should upload multiple creative variants and refresh assets regularly to support Axon’s learning engine.
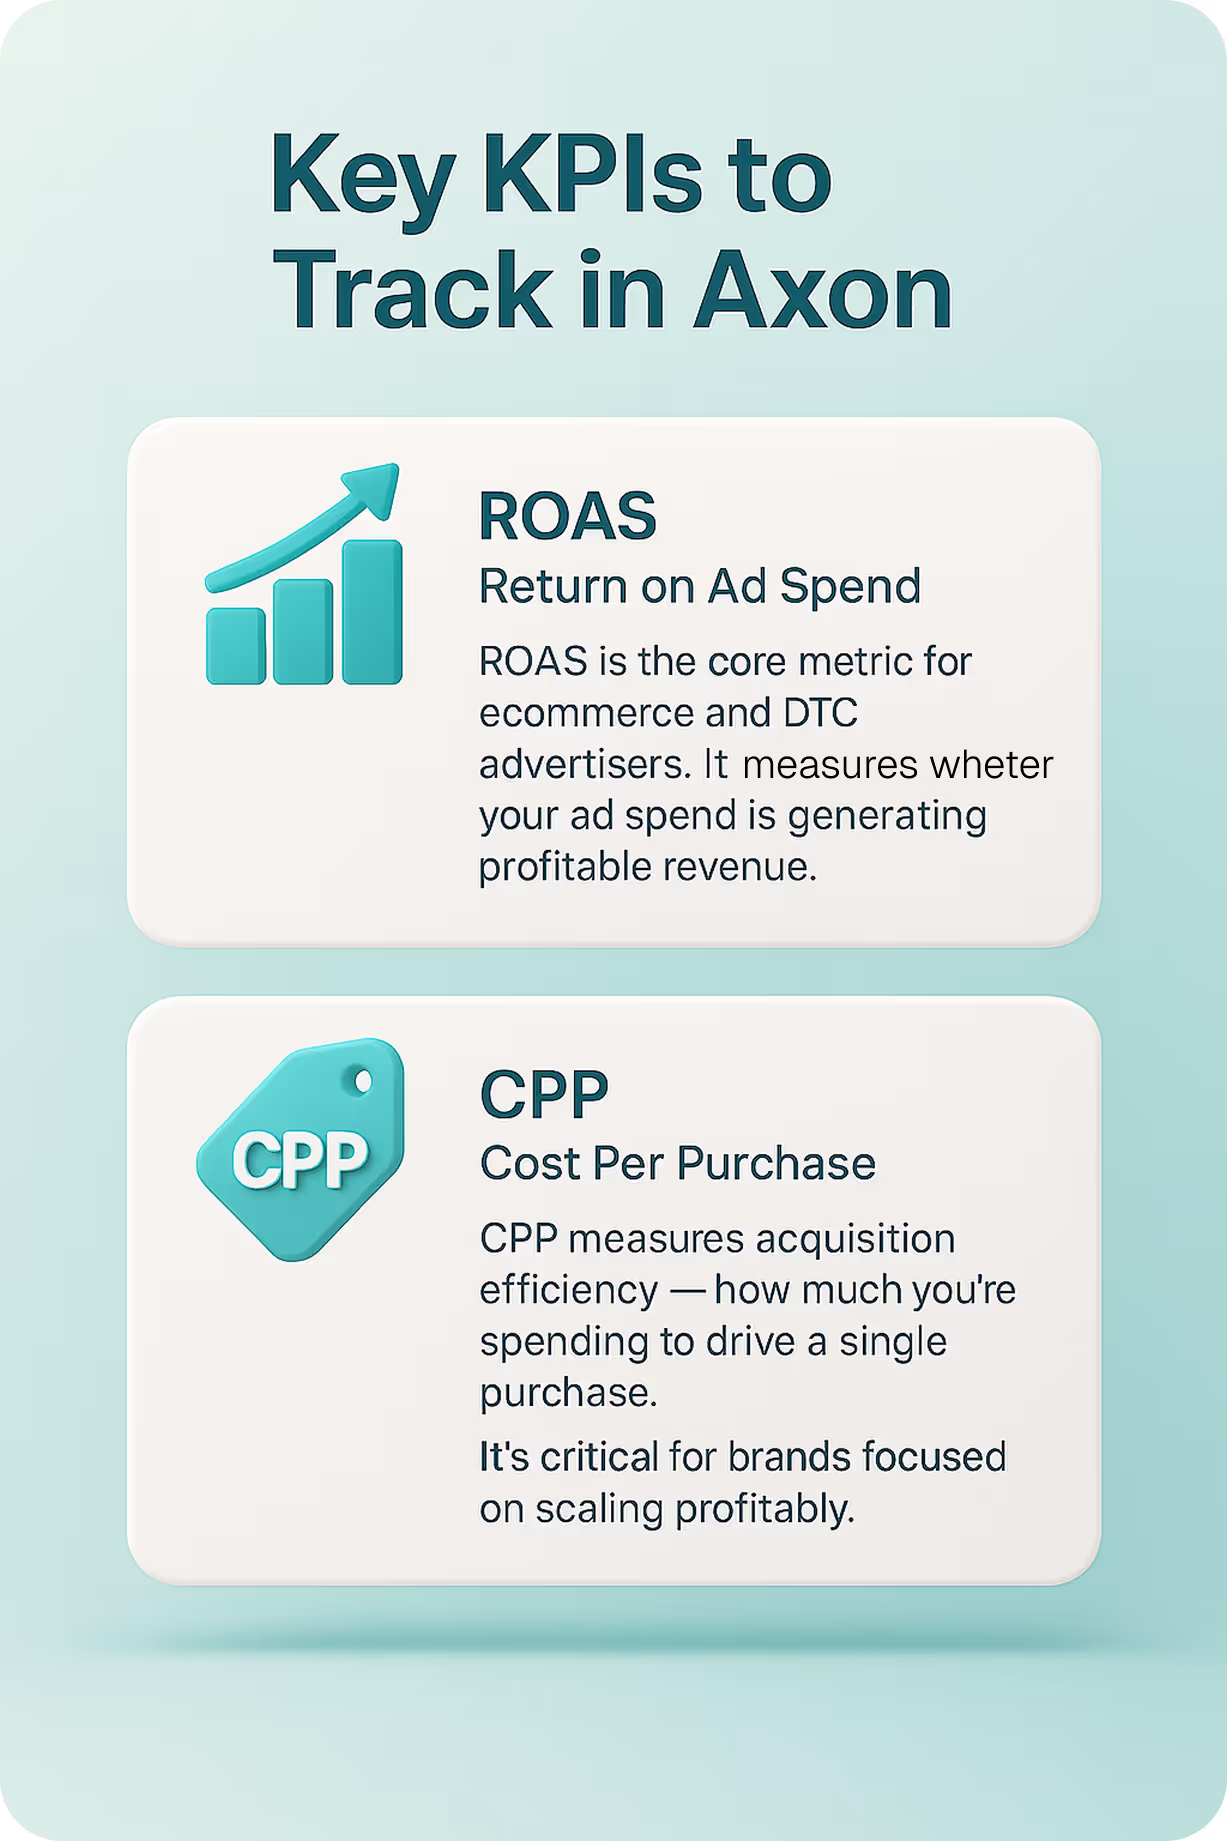
2. Key KPIs to Track in Axon
Axon is built to optimize toward meaningful goals like revenue, purchase efficiency, and conversion quality. These are the metrics that directly impact performance.
ROAS (Return on Ad Spend)
ROAS is the core metric for ecommerce and DTC advertisers. It measures whether your ad spend is generating profitable revenue.
Example: If you spend $10,000 and generate $15,000 in tracked revenue, your ROAS is 1.5 — a strong signal. If you’re only making $8,000, it’s time to revisit your creative, targeting, or event setup.
To optimize for ROAS, ensure:
- Accurate pixel installation across all key pages (checkout, confirmation)
- Proper event mapping for purchases, add-to-cart actions, and page views
- Revenue values passed with each purchase event to enable value-based bidding
ROAS is especially useful for campaigns with variable order values, such as fashion, electronics, or subscriptions.
CPP (Cost Per Purchase)
CPP measures acquisition efficiency — how much you’re spending to drive a single purchase. It’s critical for brands focused on scaling profitably.
Axon can optimize delivery to reduce CPP while maintaining conversion quality. This is especially useful for:
- Fixed-margin products
- New customer acquisition campaigns
- Seasonal or promotional campaigns
CPP also helps diagnose funnel friction. If CPP rises while CTR and page views remain stable, the issue may lie in your landing page, checkout flow, or product-market fit.
Supporting Metrics to Monitor
While ROAS and CPP are the primary optimization goals in Axon, several secondary metrics provide valuable diagnostic insight. These help advertisers understand where performance bottlenecks may exist — whether in creative engagement, user intent, or funnel design.
Conversion Rate
Conversion rate measures how effectively your traffic turns into purchases. A low conversion rate often points to friction in the user journey. This could stem from:
- Misaligned ad messaging that sets incorrect expectations
- Poor landing page UX, such as slow load times or unclear CTAs
- Gaps in product-market fit, where users click but don’t find what they need
Axon doesn’t optimize directly for conversion rate, but it uses this metric to evaluate post-click behavior and refine delivery over time.
Click-Through Rate (CTR)
CTR reflects how compelling your ad is — whether users are motivated to engage. Axon monitors CTR as an early signal of creative fatigue or misalignment.
- A declining CTR may indicate that visuals, headlines, or CTAs are no longer resonating
- Axon automatically suppresses creatives with low CTR to maintain campaign efficiency
- Regular creative refreshes help sustain engagement and prevent premature drop-off
CTR is especially useful during creative testing phases, where small changes can lead to measurable improvements in engagement.
Page View Depth
Page view depth tracks how far users explore your site after clicking an ad — how many pages they view and how deep they go into the funnel.
- High depth with low conversion suggests interest without clarity — users are browsing but not finding what they need
- This may point to confusing navigation, weak product positioning, or lack of urgency
- Axon uses this signal to assess user intent and refine delivery toward audiences more likely to convert
Together, these supporting metrics help advertisers identify where performance is breaking down — whether in the ad, the landing experience, or the product offer — and guide targeted improvements that complement Axon’s automated optimization.
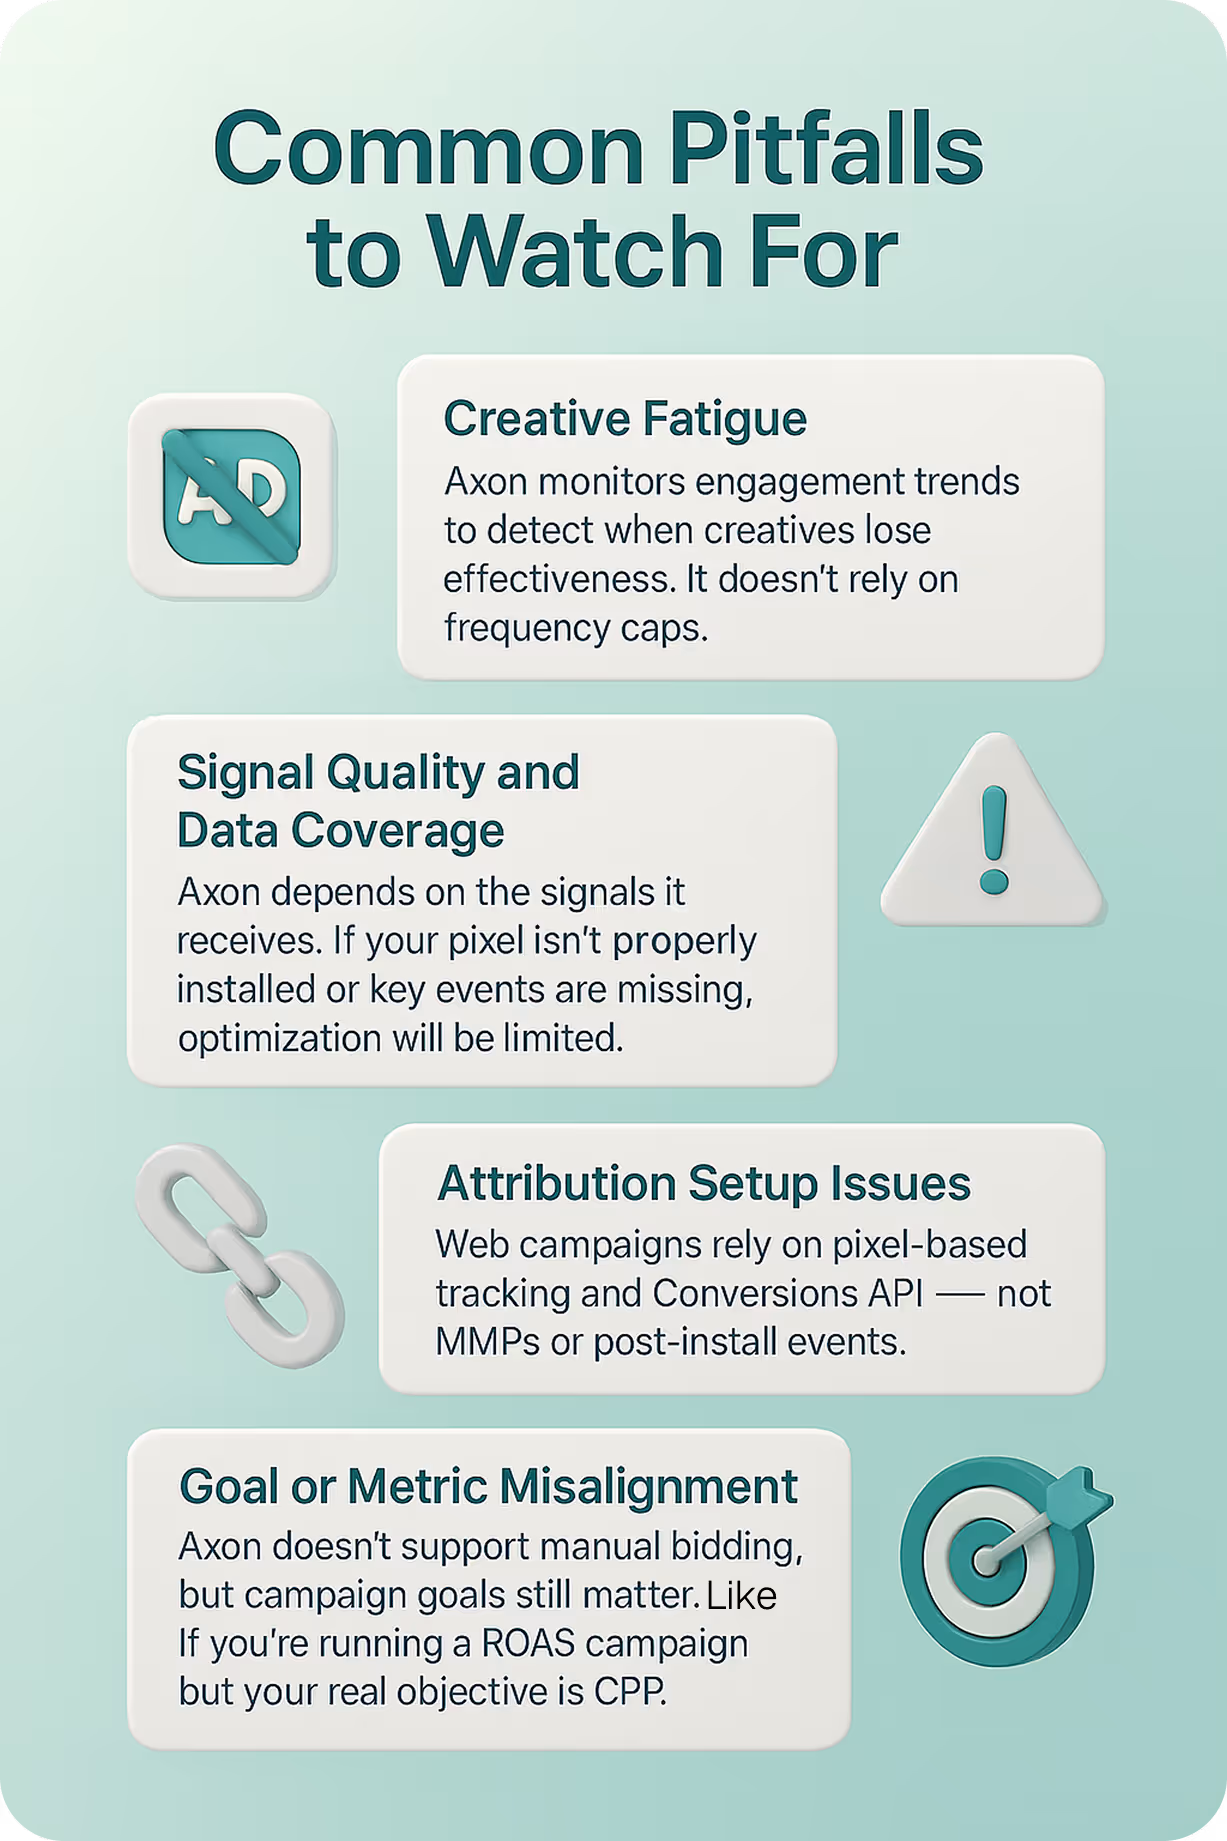
4. Common Pitfalls to Watch For
Even with a strong optimization engine, performance can dip if setup is incomplete or misaligned.
Creative Fatigue
Axon monitors engagement trends to detect when creatives lose effectiveness. It doesn’t rely on frequency caps.
- Rotate new visuals
- Test new CTAs
- Avoid running identical assets for extended periods
Creative performance is one of the strongest signals Axon uses to optimize delivery.
Signal Quality and Data Coverage
Axon depends on the signals it receives. If your pixel isn’t properly installed or key events are missing, optimization will be limited.
- Ensure pixel fires on all relevant pages
- Map events accurately in the dashboard
- Pass revenue values for purchase events when possible
The more complete and accurate your event data, the better Axon can learn and perform.
Attribution Setup Issues
Web campaigns rely on pixel-based tracking and Conversions API — not MMPs or post-install events.
- Double-check pixel placement
- Validate event triggers and conversion windows
- Ensure revenue attribution is consistent across sessions
Clean data is the foundation of smart optimization.
Goal or Metric Misalignment
Axon doesn’t support manual bidding, but campaign goals still matter. If you’re running a ROAS campaign but your real objective is CPP, results may not align.
- Select the optimization goal that reflects your business target
- Align creative messaging and landing pages with that goal
- Monitor performance metrics that match your chosen objective
5. How to Improve Axon Performance
Axon performs best when advertisers treat optimization as an ongoing process. Here’s how to support it:
- Upload Diverse Creatives
- Focus on 30-60 second videos and test a variety of creative concepts.
- Include clear CTAs and product messaging
- Refresh assets every week
- Validate Pixel and Event Setup
- Confirm pixel is installed on all key pages
- Map purchase, add-to-cart, and page view events
- Pass revenue values for ROAS optimization
- Align Campaign Goals
- Choose ROAS or CPP based on your business model
- Avoid mixing goals across campaigns
- Monitor the right metrics for your objective
- Monitor and Iterate
- Use Axon’s reporting suite or export data to Looker Studio, BigQuery, or Sheets
- Track ROAS, CPP, CTR, and conversion trends
- Adjust creatives and campaign structure based on performance insights
6. What Axon Doesn’t Do — Clarifying Misconceptions
To avoid confusion, here’s what Axon does not support:
- ❌ Manual audience segmentation: Targeting is fully automated and based on aggregated signals.
- ❌ User-level matching or cross-network targeting: Axon does not use first-party data to match individual users.
- ❌ In-app behavior tracking for web advertisers: Web campaigns rely on pixel signals, not session depth or app usage.
- ❌ Contextual placement across apps: Axon delivers performance-based ads using predictive modeling, not app-to-app placement logic.
7. FAQs
Is Axon only for mobile apps? No. Axon supports both app and web campaigns. Ecommerce brands can run high-performing campaigns using the Axon pixel — no app required.
Can I segment audiences in Axon? No. Axon’s targeting is fully automated. It uses contextual and behavioral signals to deliver ads to high-intent users.
What’s the difference between CPI and CPP? CPI applies to app installs. CPP applies to purchases on websites. Axon supports both, but CPP and ROAS are the core metrics for web advertisers.
Does Axon use first-party data for targeting? No. Axon does not match or target users based on uploaded first-party data. It uses aggregated, privacy-safe signals to optimize delivery.
How does Axon handle creative testing? Axon rotates creatives automatically based on performance. You don’t need to manually A/B test — the system adapts in real time.
Is Axon compliant with privacy regulations? Yes. Axon uses aggregated, anonymized signals and complies with GDPR, CCPA, and ATT.

Learn how to make UGC video ads that actually convert on Axon by AppLovin. Covers ideal length, hook structure, caption strategy, and the creative patterns driving real ROAS in 2026.

Discover how mobile incrementality testing in 2026 proves true ad impact. Learn from Axon case studies showing higher iROAS, stronger LTV, and halo effects across channels.